The work was supported by the Dr Klaus Tschira Stiftung
The theory of coupling between charged insulators and the calibration of our devices for measuring electric fields.
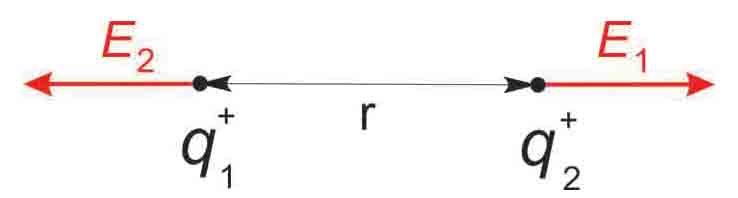
According to Coulomb’s law the force between two charges is directly proportional to the product of these charges and inversely proportional to the square of the distance between them. In the case of two positive charges q1 and q2 at rest, each charge has two roles: firstly, each charge creates an electric field with a field strength E which is inversely proportional to the square of the distance r from its source.
q1 generates a field strength of |E1|(r) = k • q1 / r2
q2 generates a field strength of |E2|(r) = k • q2 / r2
Note that in this case the principle of superposition is not applicable to calculate the resulting fields.
Secondly, each of the two charges has a repellent action on the electric field of the other charge.
A constant of proportionality k = 1 / 4 π ε0 εr is required to give the strength of the force in newtons (N) when q1 and q2 are in coulombs (C) and r in meters (m). Permittivities ε0 εr describe a material's (or matter’s) ability to transmit (or "permit") an electric field.
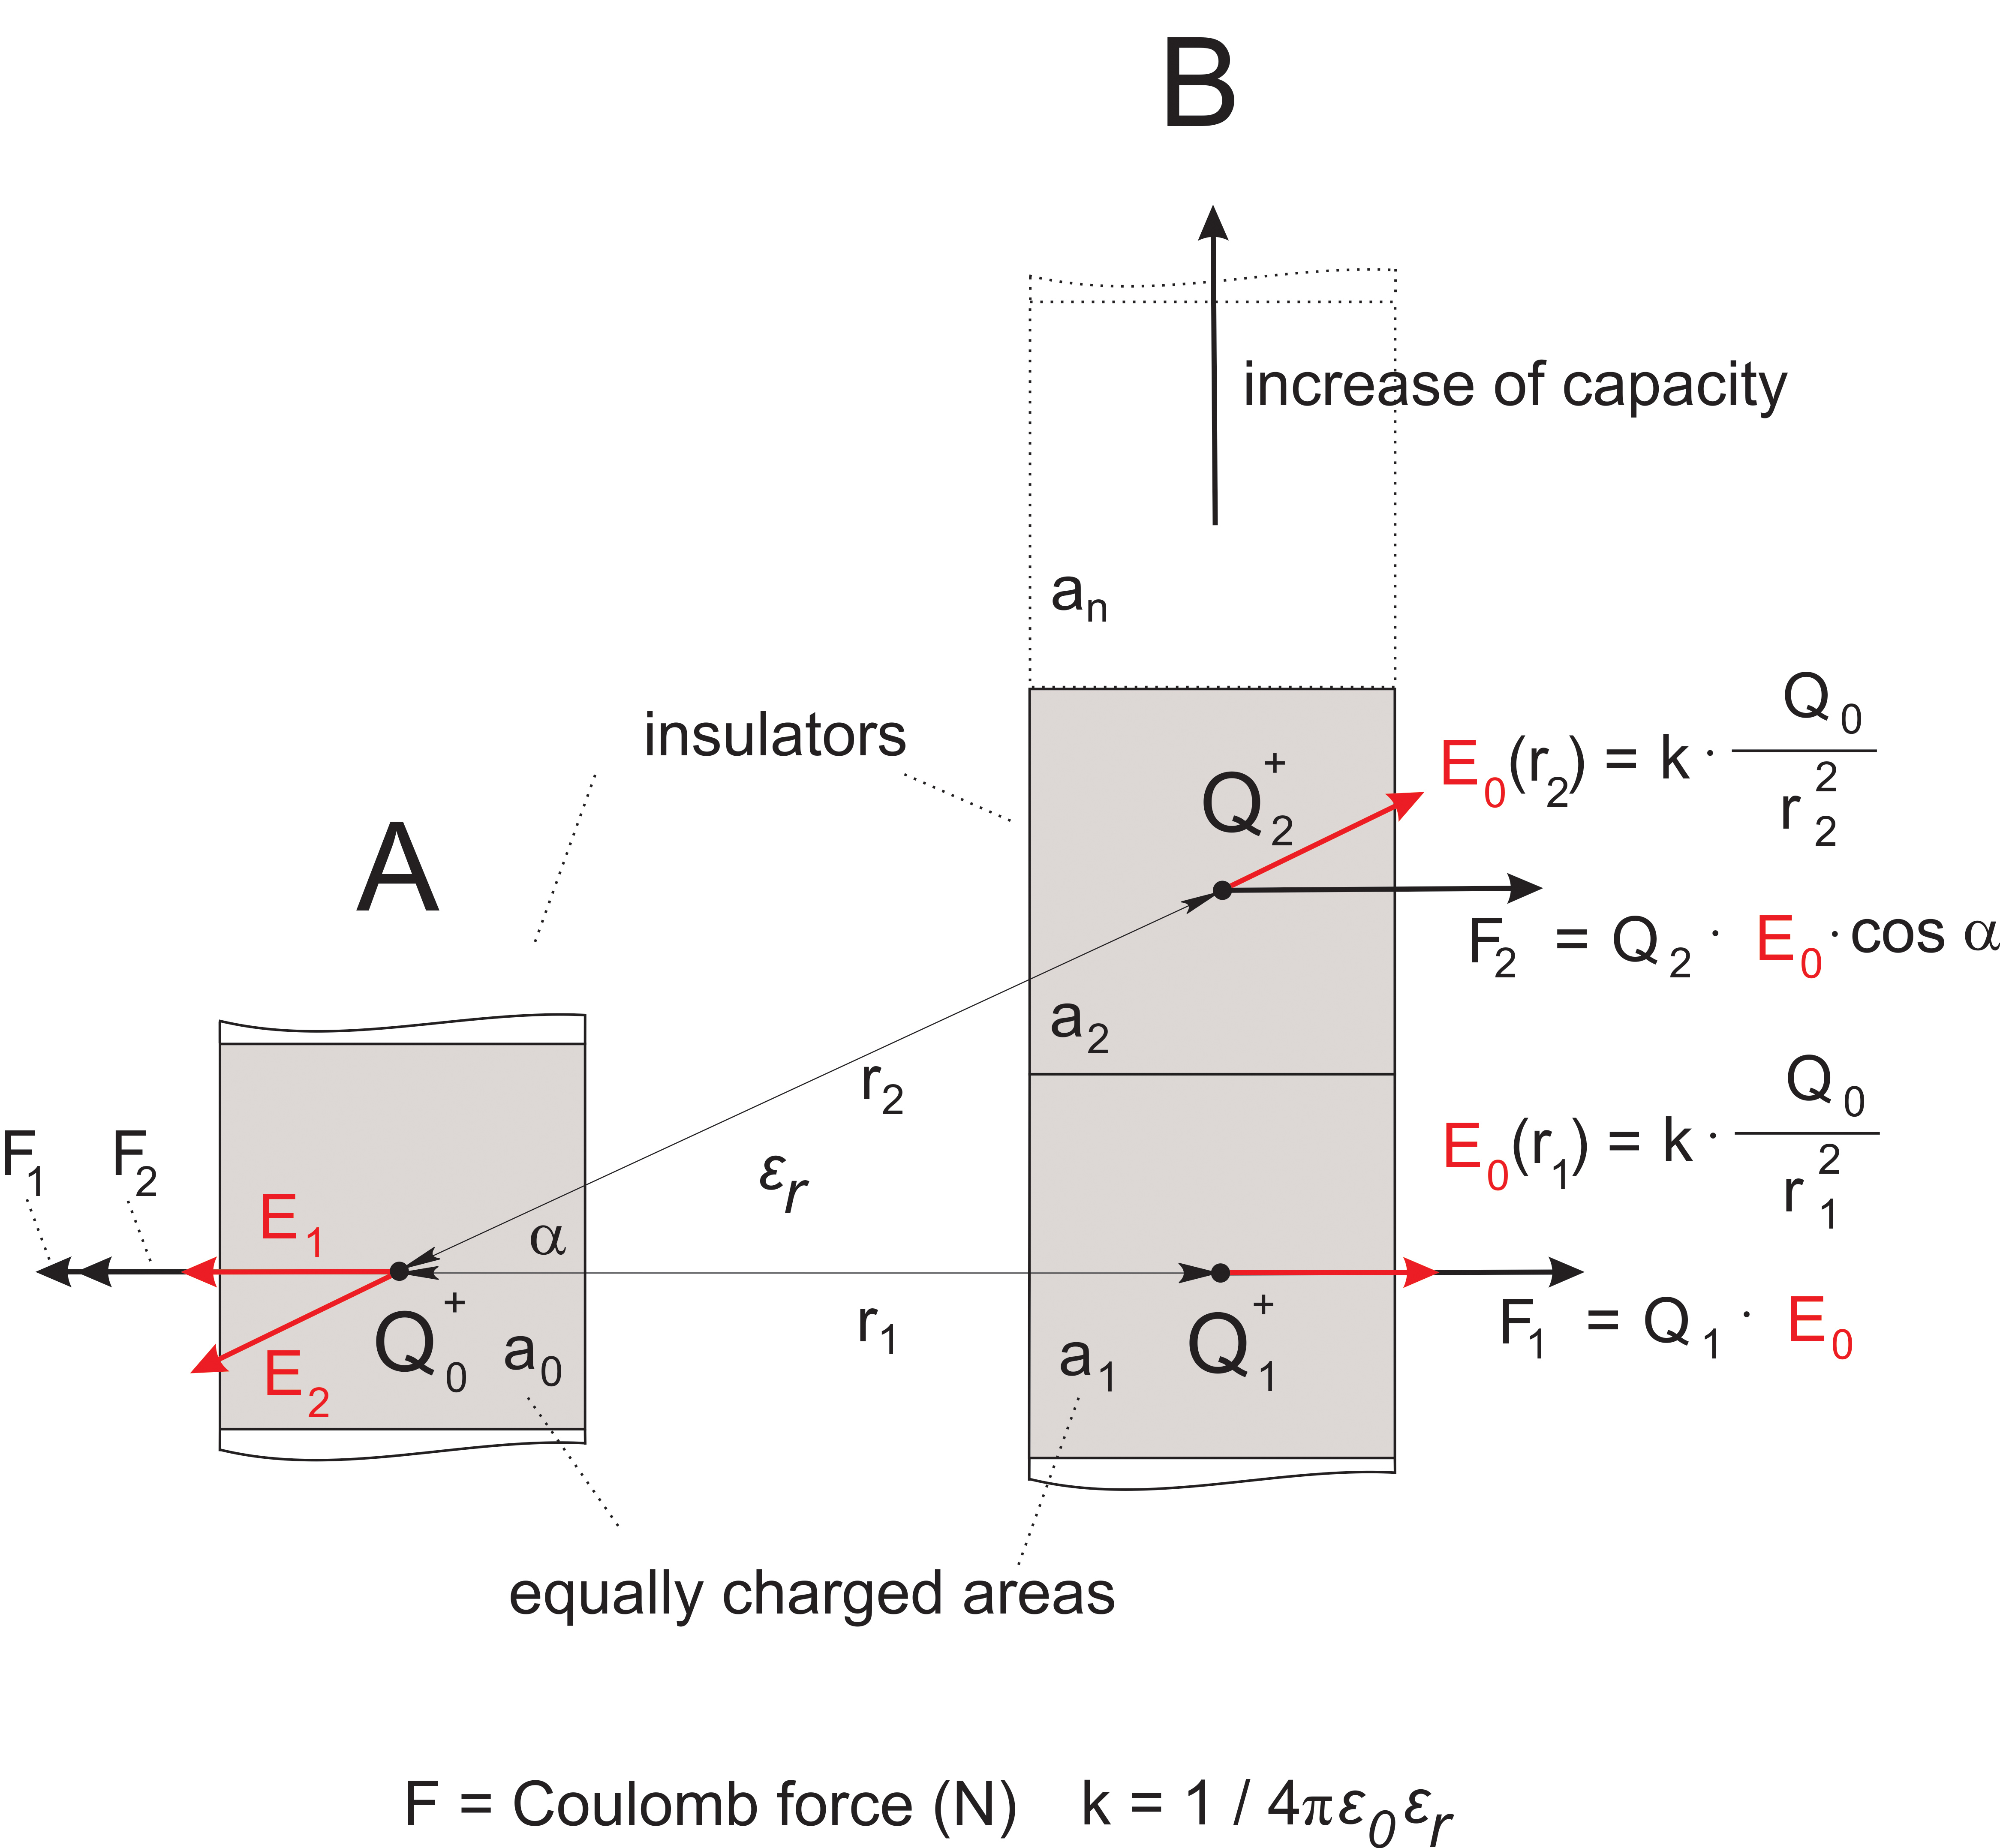
In the case of multiple charges at rest, the Coulomb forces are calculated separately for each pair of charges as described above. The overall repulsive force along the direct line between each group of charges Q is the vector sum of all Coulomb forces (in this case the principle of superposition applies) (figure S1). Simplifying the complex conditions in the case of wing-flagellum electric field coupling, we assume conditions close to those in a capacitor with a strong geometric asymmetry. The strongest coupling effect results from r1 via E1, the orthogonal vector between the two charged insulators, because the distances and the angles increase for other vectors. Thus the repellent force acts predominantly along the direct line between wing and flagellum. Manipulating the size of the wing indicated that only about 10% of the wing surface is required to cause the coupling effect (the surface ratio between a normal wing and the flagellum is about 40 : 1, thus a ratio of 4:1 is effective). During flight, all body parts of the bee are exposed to similar air friction with the wing moving only slightly faster. The polarity and strength of the charges produced differ according to the materials, surface roughness, temperature, strain, and other properties such as the degree of ionization in air. Given enough time, charging will reach a balanced state. If the concentration of positive charge per volume in the air drops, the animal will start to discharge. Overall the surface charge per equal area will be constant.
Calibration of the electrometer for measuring the electric charge of the wing beat:
As shown in figure 1 in the main text, the sensor of the electrometer is positioned at a defined distance r from the bee body with its moving wings. Assuming an equal distribution of charge Q1 to Qn along the surface area elements a1 to an (see the figure S1), the surface potential U can be determined as a function of the distances r1 to rn between coupling areas of the wing and the electrometer electrode.
The moving wing with a constant surface potential Ui at a distance r to the sensor of the electrometer will induce an electric displacement current (i) in the sensor. The electrometer can be calibrated for similar distances with known surface potential. The absolute calibration was achieved by measuring relative voltage of a very thin metal plate of the same size and shape as a bee wing connected with a thin flexible wire to a 200 V DC voltage source. This metal plate was vibrated like a bee wing at various distances to the detector. Surface areas of the unshielded parts of the receiving and transmitting electrodes are taken into account following the guide line as described above for the ratio of the effective capacitive coupling between flagellum and wing. The empirical calibration function is given in figure S2.
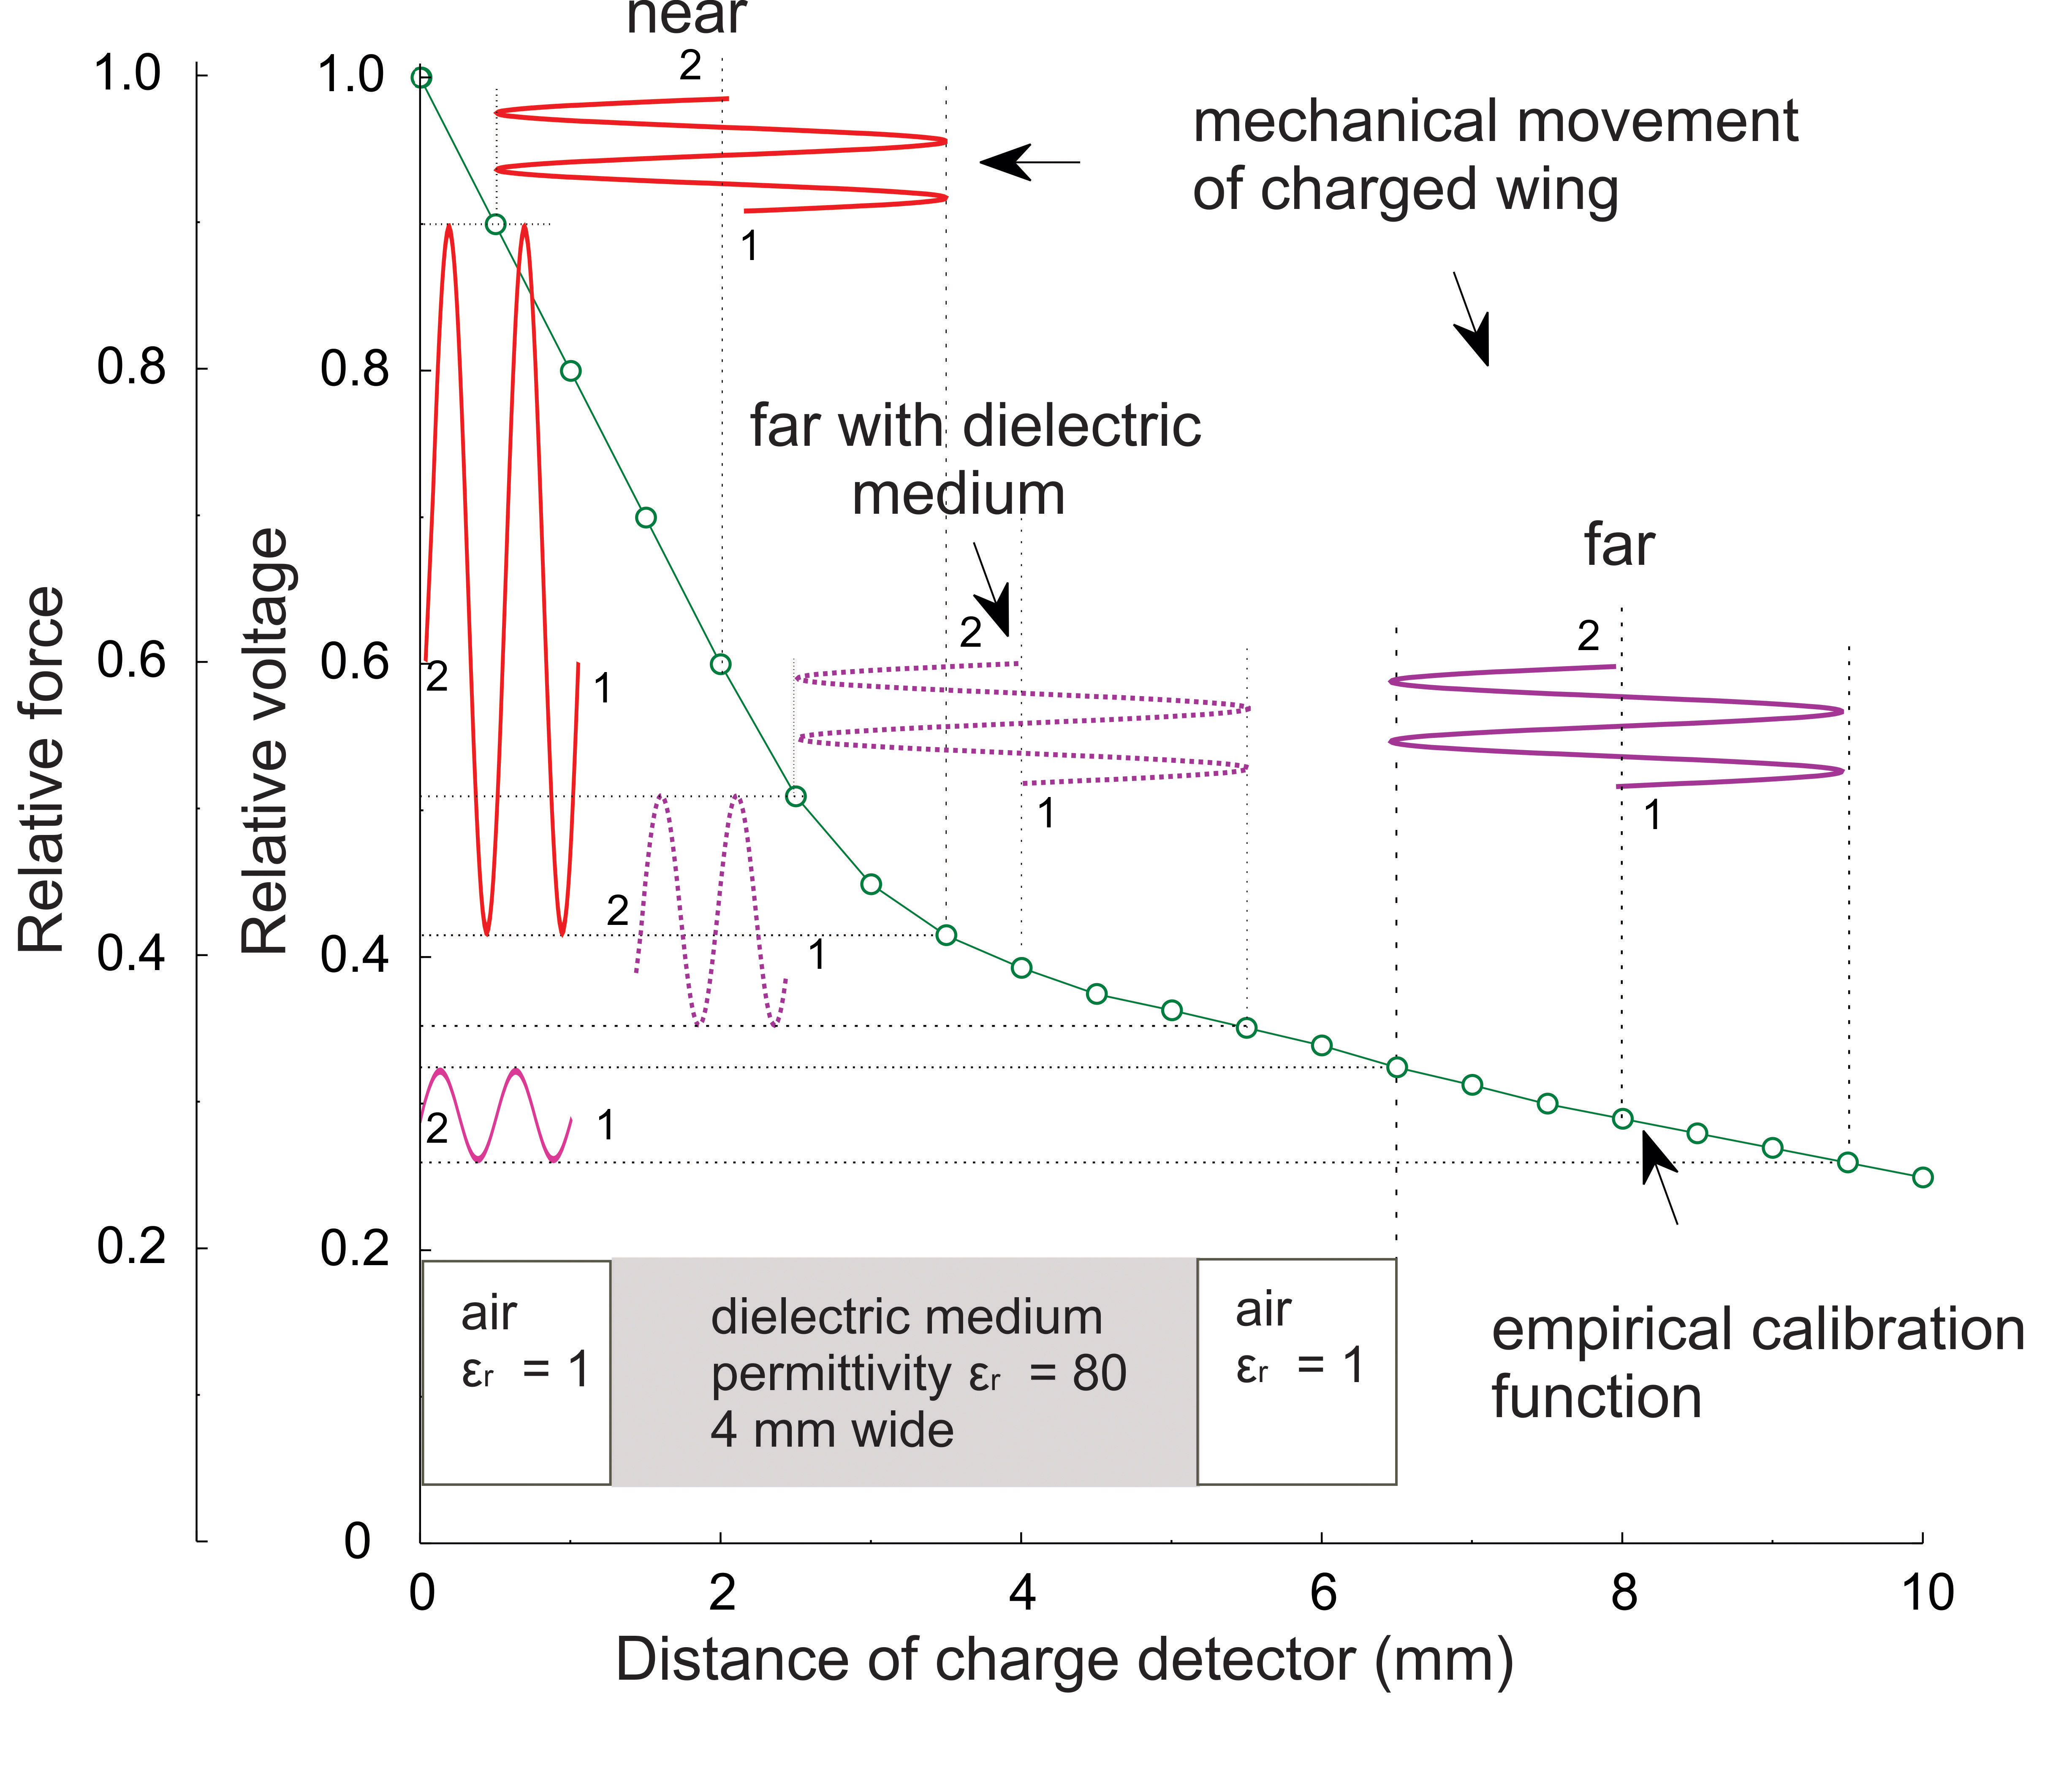
Figure S2 gives the dependence of relative force (or relative surface voltage) on the distance to the charge detector. The DC component shown in figure S2 was calculated and cannot be read by the electrometer due to the capacitive coupling of the voltage signal with the sensor. Movement of the wing in the near field (near) induces high modulations of voltage readings and correspondingly high modulations of force. Movements at far distance (far), only low modulations. However, if the dielectric medium has a very high permittivity compared to air e.g. in the case of a bee standing between an emitting bee and a receiving bee even far distant movements will lead to high modulations. The dielectric medium increases the coupling capacity which decreases the surface voltage of the wing. In consequence, the fast moving wing will gain an additional charge by friction (‘dielectric charging’) resulting in an increase of the effective Coulomb forces. A similar effect can be achieved by a conductive medium such as haemolymph. Notice that the distance between wings of a dancing bee and the flagellae of dance-following bees lies in the range of 0.5 to 4 mm.
Electric fields of flying bees
The surface potential of bees arriving at the hive entrance was measured with an electrometer array with 8 electrodes at the hive entrance. Figure S3a depicts this measuring device, and figure S3b shows the distribution of the surface potentials of arriving bees. The distribution of the modulated electric signals as induced by wing movement of arriving bees was picked up when the bee was still in flight. After landing the electric field is reduced by up to 5% (not shown).
Behavioural responses to an electric field
Resting bees standing on a Styrofoam ball floating in an air stream respond to an electric field with antennal movement. In the experiment shown in figure S5 the animal was stimulated with the dance pattern (see figure 2) transmitted as an electric field by a copper electrode in front of the animal at a distance of 3 mm to the flagellae.
Figure captions Figure S1 Capacitive coupling.
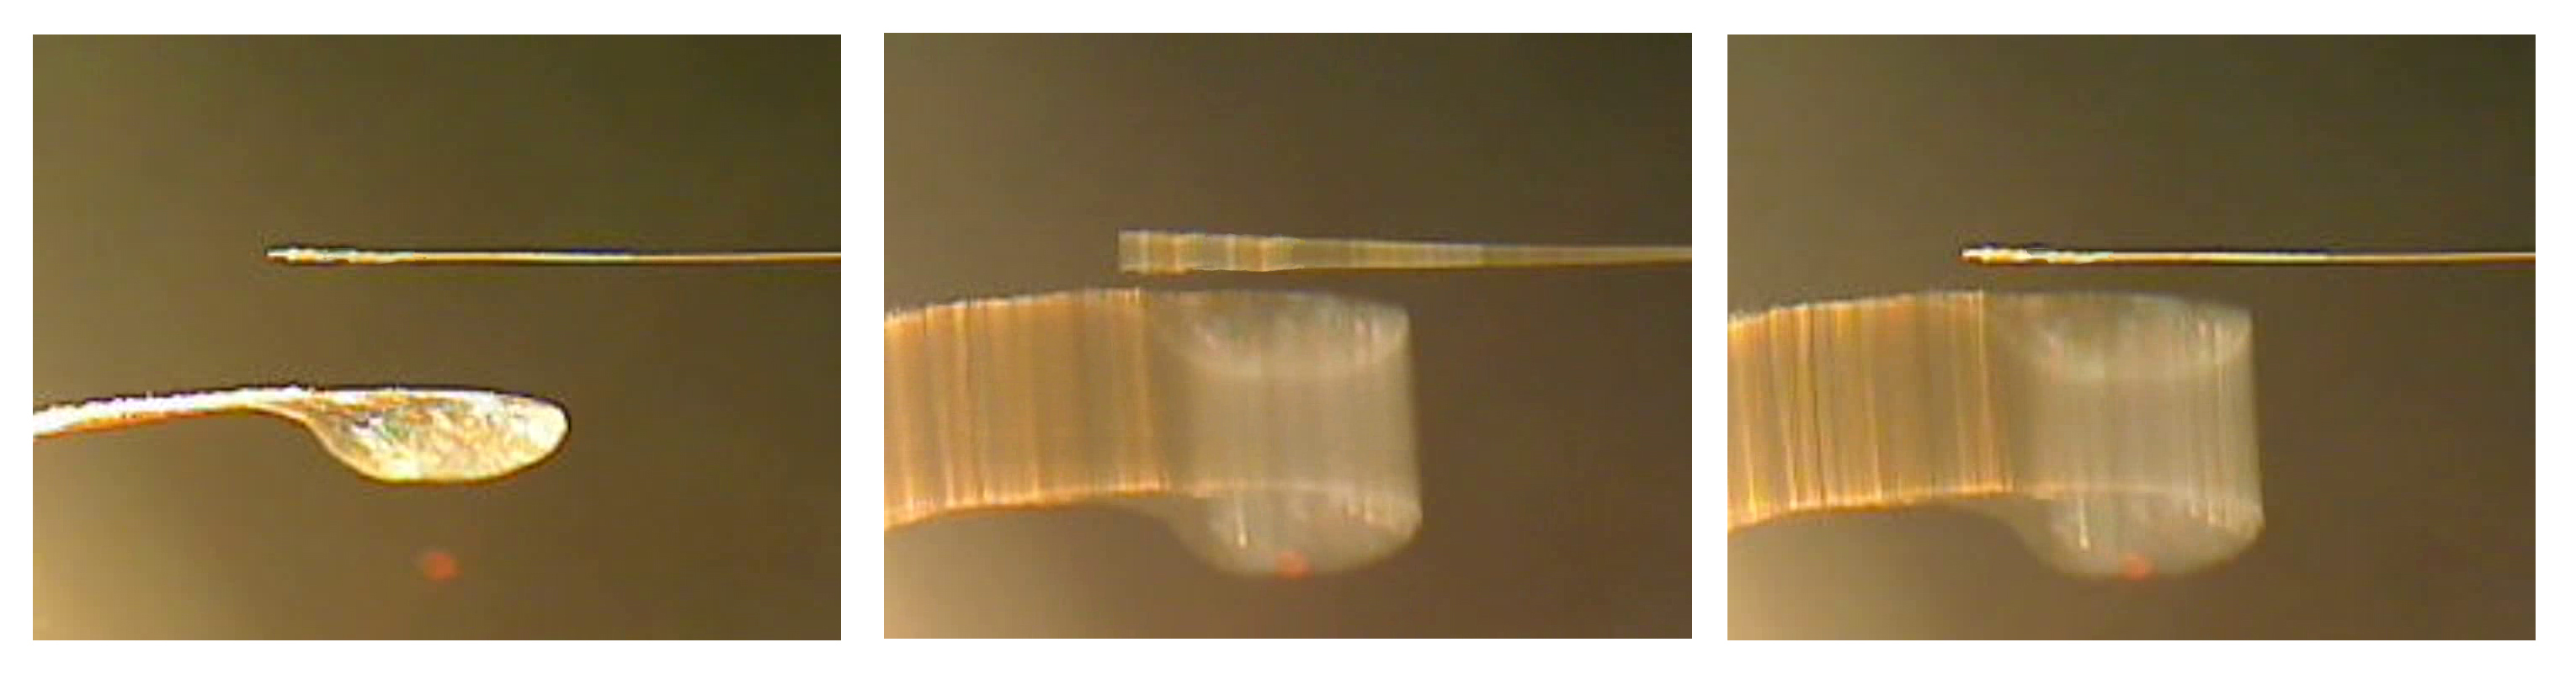
(a)
Electric coupling of wing and flagellum. Left: The flagellum is glued to the tip of a human hair, which simulates the muscle force and joint flexibility of the flagellum. The wing is mounted to a thin plastic stick driven by a loudspeaker with its sound suppressed and placed at a distance of 3mm from the flagellum. Middle: The wing vibrates at the resonance frequency of the hair to keep the coupling force at a minimum. The wing swing amplitude is 3mm . Right: Discharged flagellum (or wing). The coupling effects from the acoustic force can only be seen at high resolution. This demonstrates that the driving electric force F is proportinal to the product of Qflagellum and Qwing according to Coulomb’s law. When one of the charges Qflagellum or Qwing is zero or neutral, an electric field but no force can be detected between the body parts.
(b)
Asymmetric capacitor configuration of wing and flagellum. Assuming an equal distribution of charge Q0 to Qn along the surface areas a0 to an , the surface potentials U0and U1,2 can be calculated as a function of the distances r1 to rn. Un = Qn / Cn = f(rn) are constant for a0 to an. The factor by which wing area and site-specific charge can be increased while still adding to the repulsive force along the direct line between the body parts is empirically determined to be about four. Permittivities ε0 εr describe a material's (matter’s) ability to transmit (or "permit") an electric field.
Figure S2
Dependence of relative force (or relative surface voltage) on the distance to the charge detector. The ordinate gives the relative voltage nominated as the attenuation coefficient for the oscillation amplitude of the voltage source. The DC component shown was calculated and cannot be read by the electrometer due to the capacitive coupling of the voltage signal with the sensor. The calibration function (green line) was measured for each detector device, and the asymmetry of the signal detected was used to derive the DC potential shown as offset in the figure. The absolute calibration was achieved by measuring relative voltage of a very thin metal plate of the same size and shape as a bee wing connected with a thin flexible wire to a 200 V DC voltage source. This metal plate was vibrated like a bee wing at various distances to the detector. Notice that the received signal is distorted by the non-linear calibration function. This distortion provides us with the information for reconstructing the original signal including the DC offset. By reading the vibration amplitude and distance to the source we can identify the section of the green calibration function which can then be used to reconstruct the original signal. The corresponding static relative force for the example ‘near’ is 0.6. In the case of haemolymph between wing and electrode or flagellum both higher electric conductivity and permittivity bridges the containing volume and by this leads to stronger capacitive coupling due to the fact that the distance as given as an example is effectively decreasing from 6.5 to 2 mm.
Figure S3 Electric charge of arriving bees at the hive entrance.
(a)
The electric charge carried by bees arriving at the hive entrance was measured with an electrometer array consisting of eight electrodes. The electrodes picked up the electric field at a distance of 2 - 3 cm both during the last 1-2 cm of flight and after landing. Diameter of the inner landing tube was 2 cm, the outer landing tube which prevented the bees from touching the electrodes was 6 cm.
(b)
Voltage distribution as induced by the wing beat of arriving foragers at the entrance to the observation hive (n = 436). The experimentally determined curve is close to the theoretically expected 1/r2 function. Therefore, the abscissa can be extended to longer distances between voltage source and detector. Notice that each of the eight electrodes was calibrated separately, and capacitively coupled to the amplifier. These data were collected at a temperature of 27° C and 35% relative humidity. Due to the fact that the bee has 4 wings here we get the reading from 2 overlaping wings on each side. One wing has two layers of charge. To estimate the surface voltage of a single layer the reading should be divided by the number of effective layers which is four resulting in a mean value of about 50Vpp.
Figure S4
Positioning of a bee for laser vibrometric measurements of its antennae. The left figure shows the position of one flagellum, the right figure depicts the vibrating wing in front of the test animal. The red point shows the laser beam. The black square in the background is the sound pressure detector. The images were taken with the calibration camera of the set-up.
Figure S5
Antennal responses of a bee standing stationary on a Styrofoam ball floating in an air stream. The animal is stimulated by the electric field dance pattern (see figure 2 in the main text) transmitted by the copper electrode in front at a distance of 3 mm to the flagellae. After several hours of walking on the ball the animal rests, loses its muscle tonus and has its flagellae pointing downwards (idle state, first picture left). The animal raises its flagellae (antennal response, third picture from left) after the stimulus begins (second picture from left) indicated by the illuminated infrared LED in the left background). The fade-out phase lasts up to 50 s for electric field stimulation in the range (20 - 80Vpp). (See movie S1 for more information)
movie S1
Response of resting bees to electric signals. A bee standing on a Styrofoam ball floating on air is exposed to electric field signals transmitted by the copper electrode in front at a distance of about 5 mm to the flagellae. After several hours of walking on the ball the animal rests, loses its muscle tonus and has its flagellae pointing downwards (idle state). The movie shows ongoing stimulation at intervals of 1 minute with low amplitudes of an electric field in the range of 20 - 80 Vpp at a distance of 5 mm due to our finding that under these conditions the fade-out phase is less than 50 s. The movie begins with a long fade-out phase after stimulation followed by 8 electric field stimulations, i.e. the 700 ms waggle rhythm (see figure 2), of various strengths indicated by the infrared LED which is invisible to the bee’s eye. The bee shows graduated responses with varying delays before the flagellae revert to the resting state. Little spontaneous behaviour is observed, e.g. at 3min 45s.